📊 Dynamic Charts-Based Analysis
Overview
This system enables dynamic visualization of analytics through a structured interface where chart configurations and their associated query data are loaded from the middleware and dynamically executed on the backend and displayed to logged Mobile User.
🏗️ Architecture
Frontend
Loads chart definitions and series configurations via API.
Renders UI elements (chart names, types, toggles for transposing, etc.).
Visualizes charts (Bar, Pie, etc.) using metadata and associated query results.
Middleware
Acts as the intermediary service to fetch:
Query metadata (IDs, chart types, axis configuration, etc.).
SQL queries for backend execution.
Role-based access control (e.g., role profile like
Manager,1, etc.).
Backend
Executes the SQL queries against the Leads or Expense database.
Filters and aggregates data based on parameters (e.g.,
fromTimeValue,toTimeValue,Mobile_User_Email).Returns results to the middleware for forwarding to the frontend.
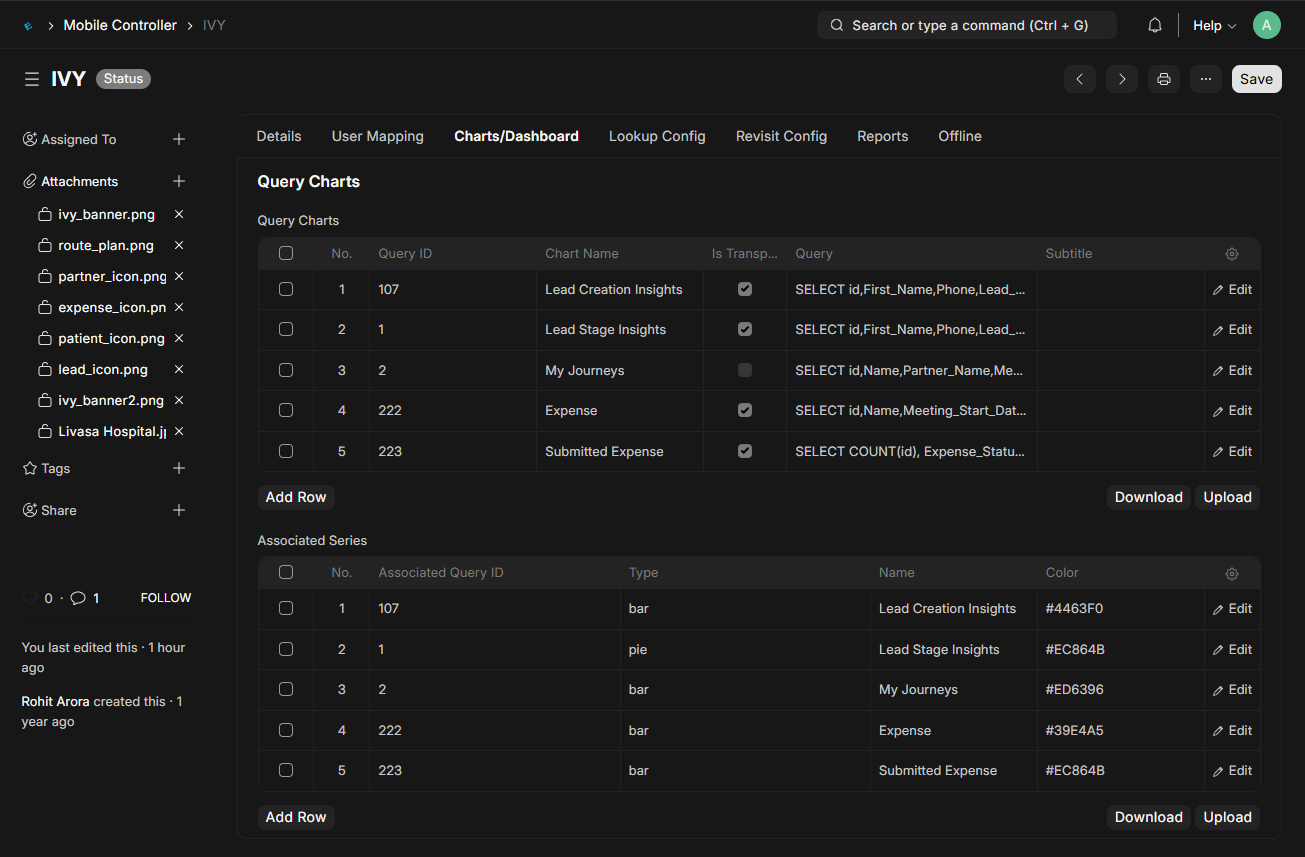
📁 Chart Configuration Tables
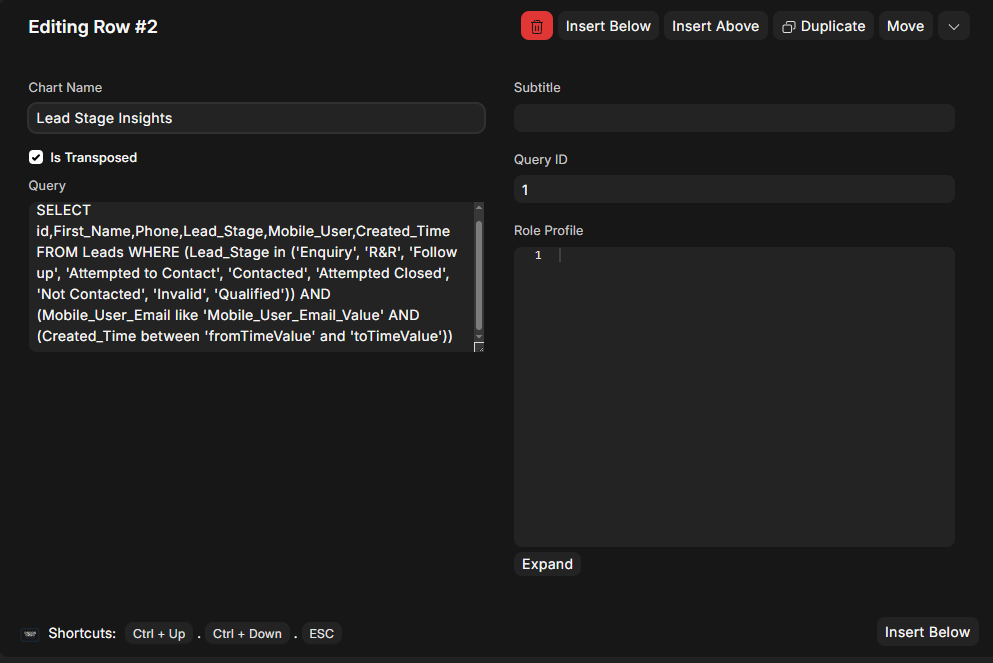
A. Query Charts Table
Contains chart configuration metadata.
Field | Description |
|---|---|
Query ID | Unique identifier to link with SQL logic |
Chart Name | Descriptive title of the chart |
Is Transposed | Whether chart data is transposed |
Query | SQL query used to fetch backend data |
Role Profile | Who can access the chart (e.g., |
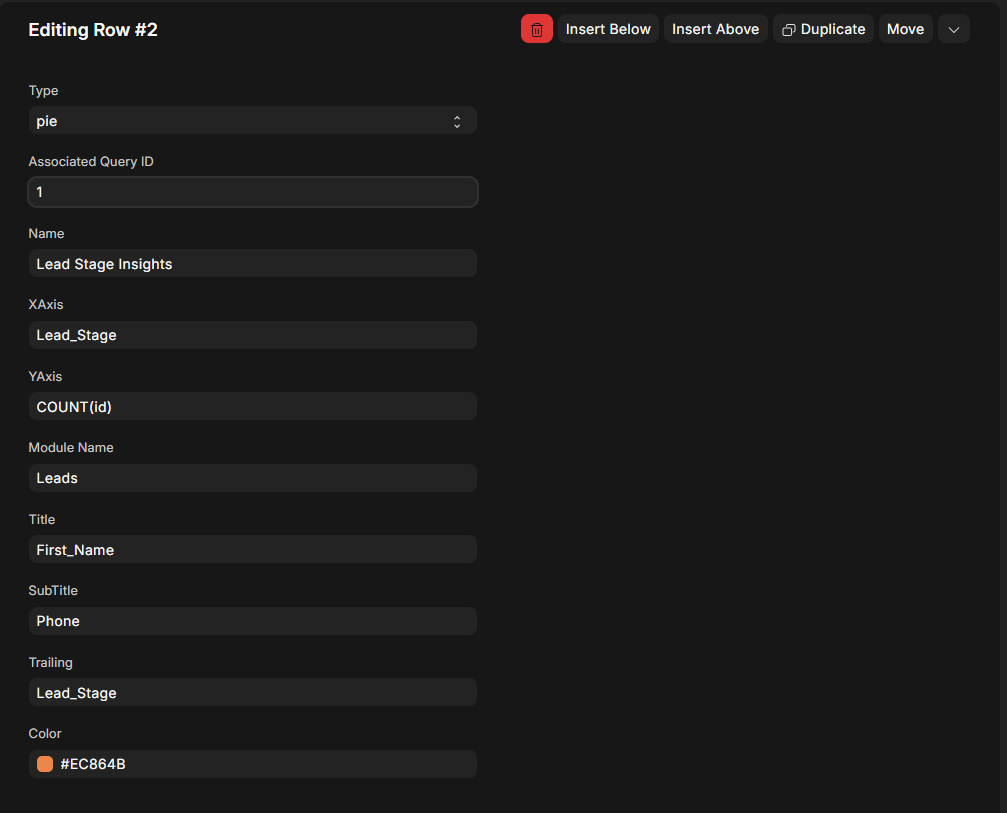
B. Associated Series Table
Defines how the chart will be rendered.
Field | Description |
|---|---|
Associated Query ID | Reference to Query ID from Query Charts |
Type | Chart type (e.g., bar, pie,line) |
XAxis | Field for X-axis visualization |
YAxis | Field/metric for Y-axis (e.g., COUNT(id)) |
Module Name | Source module/table (e.g., Leads, Expense) |
Color | Color used in chart display |
Title / Subtitle | Labels used for display context |
🔐 Role-Based Access
Each chart is mapped with a Role Profile, allowing granular visibility:
Chart Name | Role Profile |
|---|---|
Lead Stage Insights |
|
Lead Source |
|
🔄 Dynamic Behavior
Middleware fetches and assembles data dynamically based on:
User role
Chart definition
Query and series configuration
Query execution occurs only when the chart is rendered.
Chart rendering is flexible with support for multiple types and data groupings.
🛠️ Maintenance Tips
Ensure Query ID is unique and consistently used across both tables.
Always validate SQL queries before deploying.
Use intuitive chart names for clarity in dashboards.
Color codes should follow a consistent theme for visual alignment.