3rd Party Library Dashboard
AmCharts 5 is a JavaScript charting library that allows users to create data visualizations. It includes a variety of chart types, such as line, bar, area, scatter, candlestick, and more. AmCharts 5 is designed to be lightweight, flexible, and feature-rich. It's also built with TypeScript and supports strong type and error checking.
Follow below steps for download amcharts in your app-
Go to your custom app- then go to public folder, inside this, run this command-
npm initIn public folder,make a custom.bundle.js file inside js folder in which you import amcharts library.
You can download amcharts using this command-
npm install @amcharts/amcharts5you can confirm the installation by checking the
node_modulesfolder:npm list @amcharts/amcharts4Define your custom bundle.js file in hooks.py-
app_include_js = "page.bundle.js"
Import Amcharts in js file-
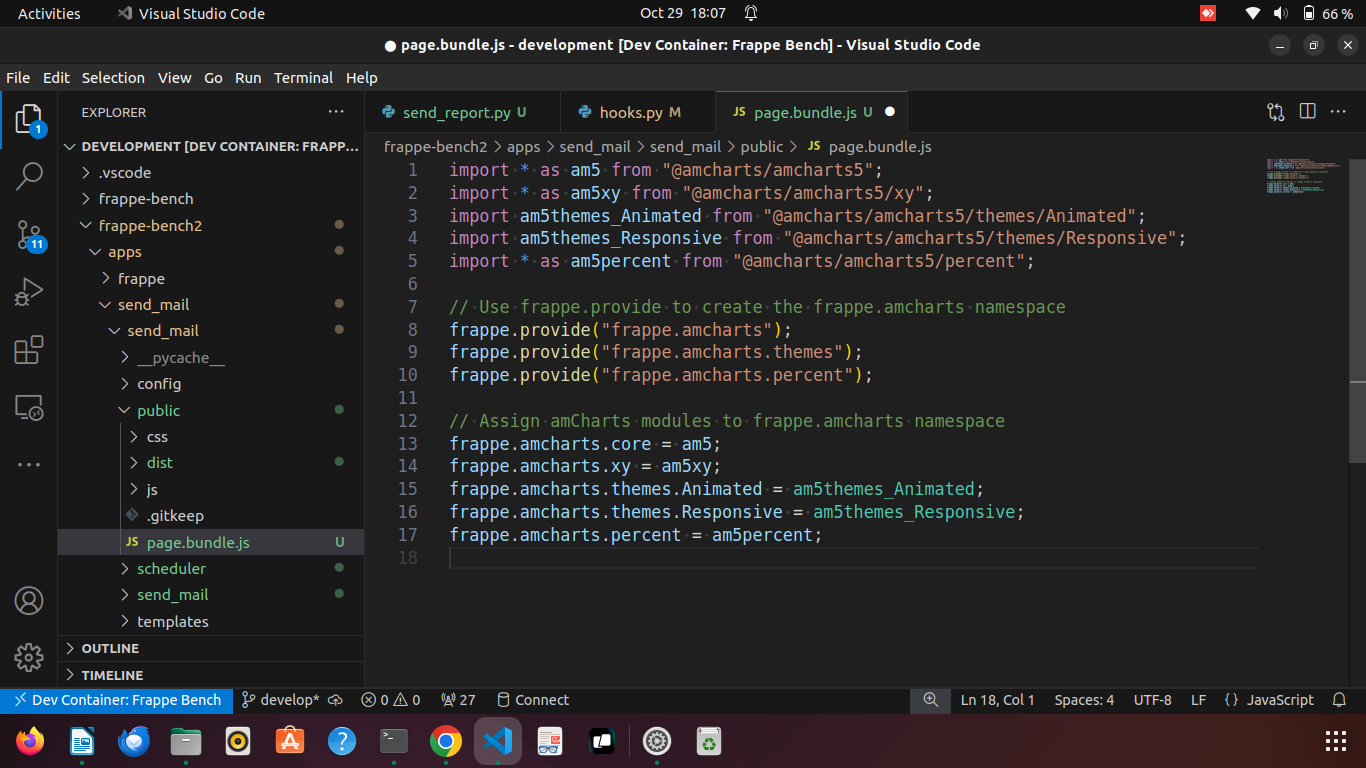
Import all library and provide namspace .In amCharts,
provideis used in combination with the modules feature to register and load specific chart components (modules) without needing to import each individually.
After write your code, you have to run command bench build in terminal.
Go on frappe UI-search Custom Html Block List-
Create New file ,
now add Your css, js and html in the file.
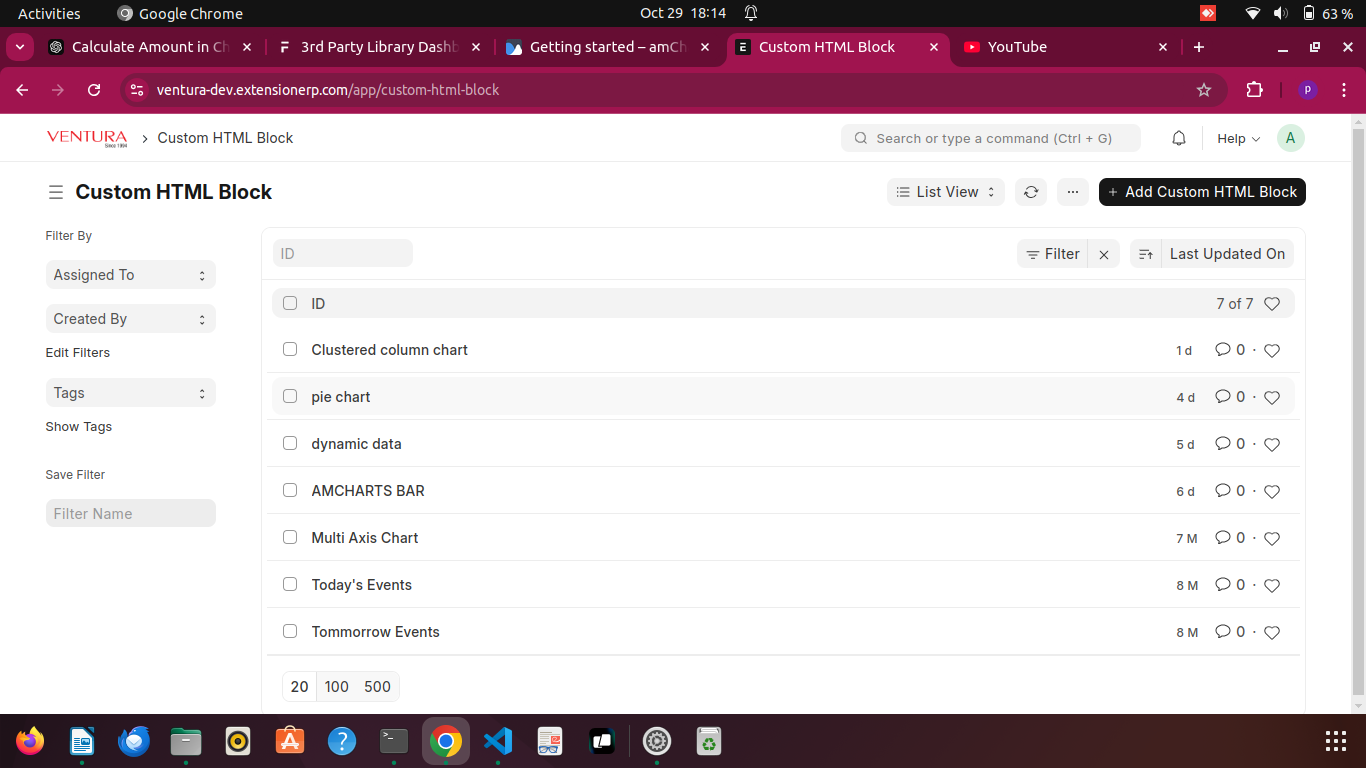
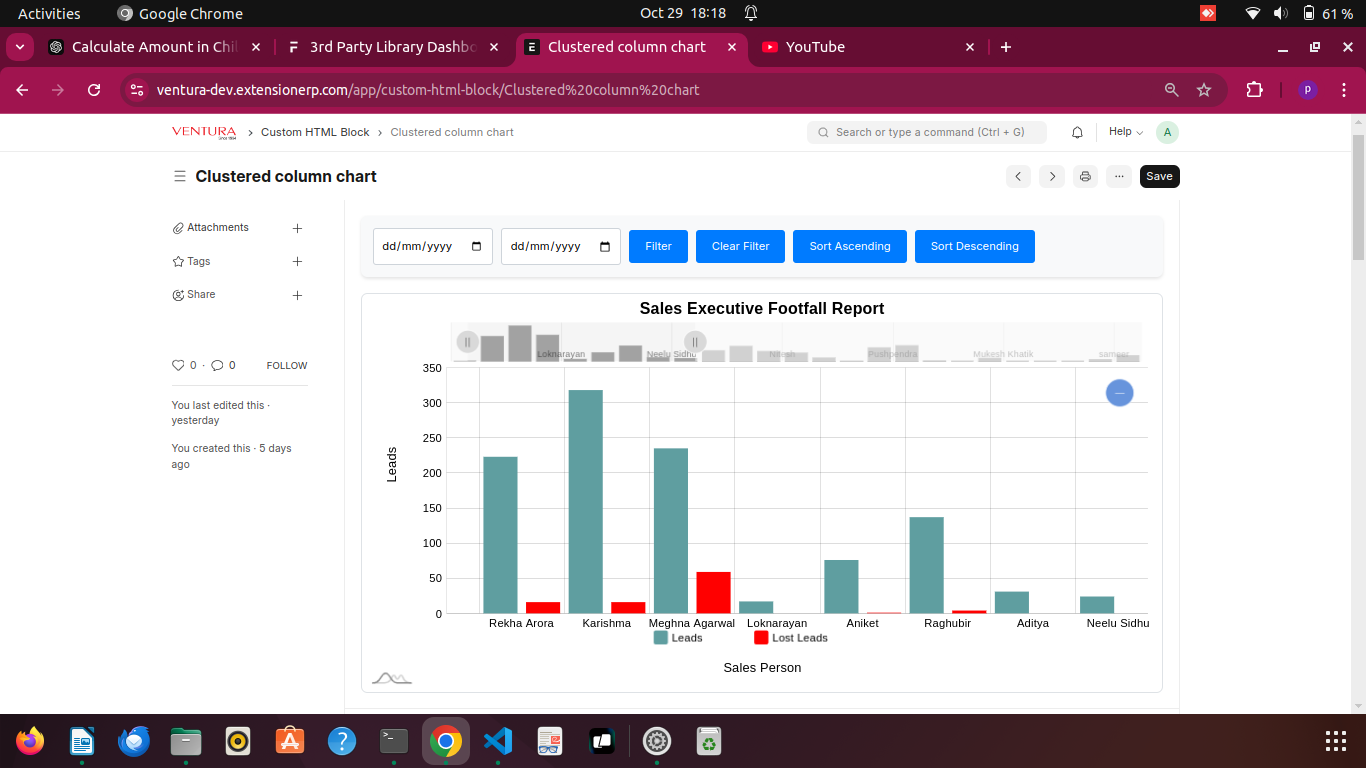
We take example of Clustered Column Chart.
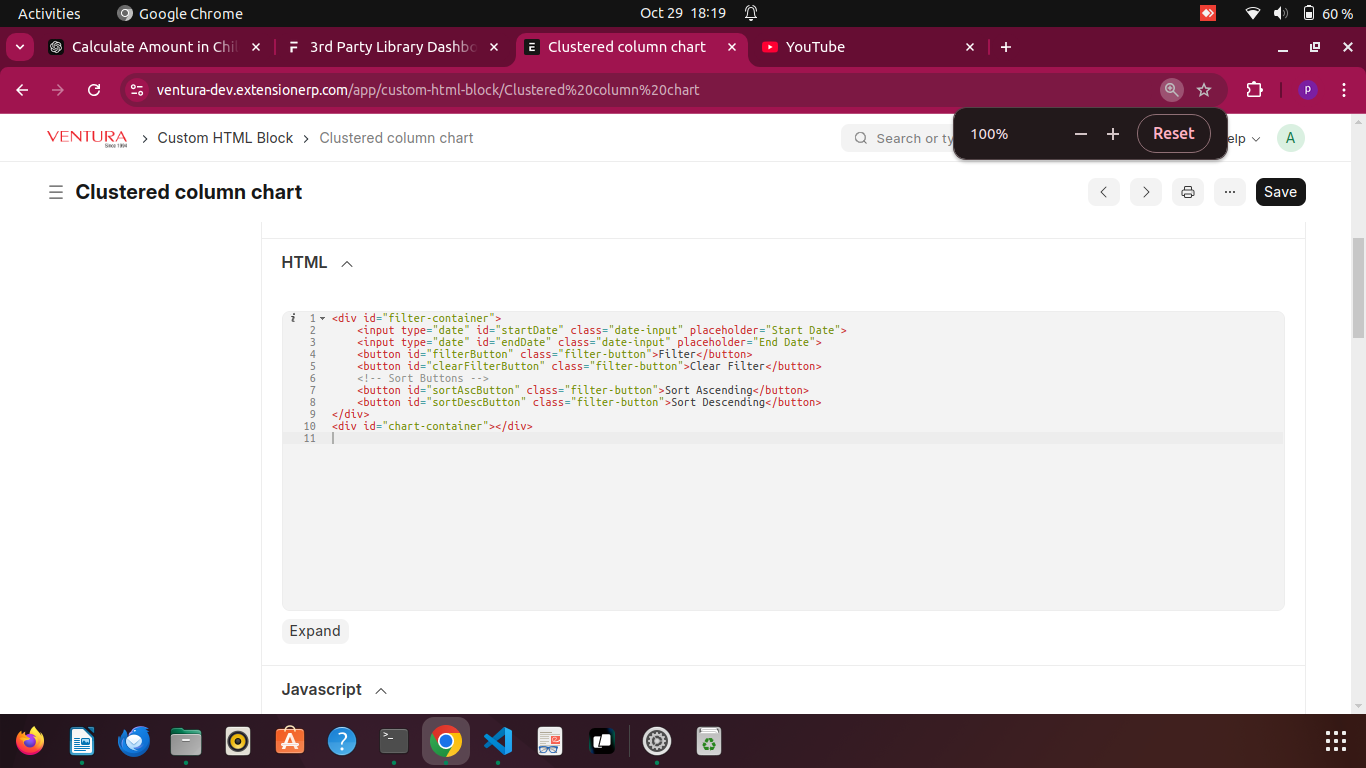
HTML Code-

<div id="filter-container">
    <input type="date" id="startDate" class="date-input" placeholder="Start Date">
    <input type="date" id="endDate" class="date-input" placeholder="End Date">
    <button id="filterButton" class="filter-button">Filter</button>
    <button id="clearFilterButton" class="filter-button">Clear Filter</button>
    <!-- Sort Buttons -->
    <button id="sortAscButton" class="filter-button">Sort Ascending</button>
    <button id="sortDescButton" class="filter-button">Sort Descending</button>
</div>
<div id="chart-container"></div>
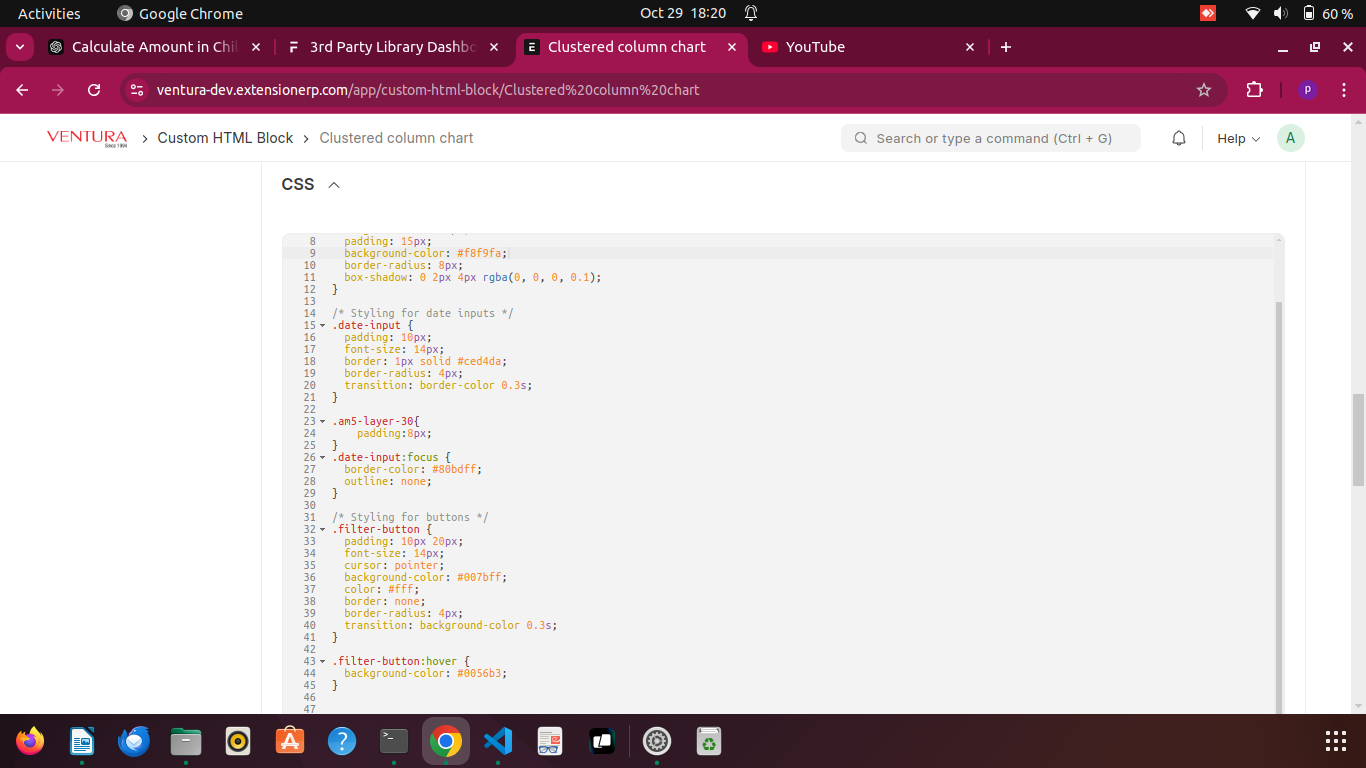
CSS Code-
/* Container for filters */
#filter-container {
  display: flex;
  flex-wrap: wrap;
  align-items: center;
  gap: 10px;
  margin-bottom: 20px;
  padding: 15px;
  background-color: #f8f9fa;
  border-radius: 8px;
  box-shadow: 0 2px 4px rgba(0, 0, 0, 0.1);
}

/* Styling for date inputs */
.date-input {
  padding: 10px;
  font-size: 14px;
  border: 1px solid #ced4da;
  border-radius: 4px;
  transition: border-color 0.3s;
}

.am5-layer-30{
    padding:8px;
}
.date-input:focus {
  border-color: #80bdff;
  outline: none;
}

/* Styling for buttons */
.filter-button {
  padding: 10px 20px;
  font-size: 14px;
  cursor: pointer;
  background-color: #007bff;
  color: #fff;
  border: none;
  border-radius: 4px;
  transition: background-color 0.3s;
}

.filter-button:hover {
  background-color: #0056b3;
}


.filter-button:active {
  background-color: #004085;
}

/* Chart container styling */
#chart-container {
  width: 100%;
  height: 500px;
  border: 1px solid #dee2e6;
  border-radius: 8px;
  overflow: hidden;
  background-color: #ffffff;
}

/* Tooltip Styling (Optional Enhancement) */
.amcharts-tooltip {
  font-size: 12px;
  padding: 5px 10px;
}
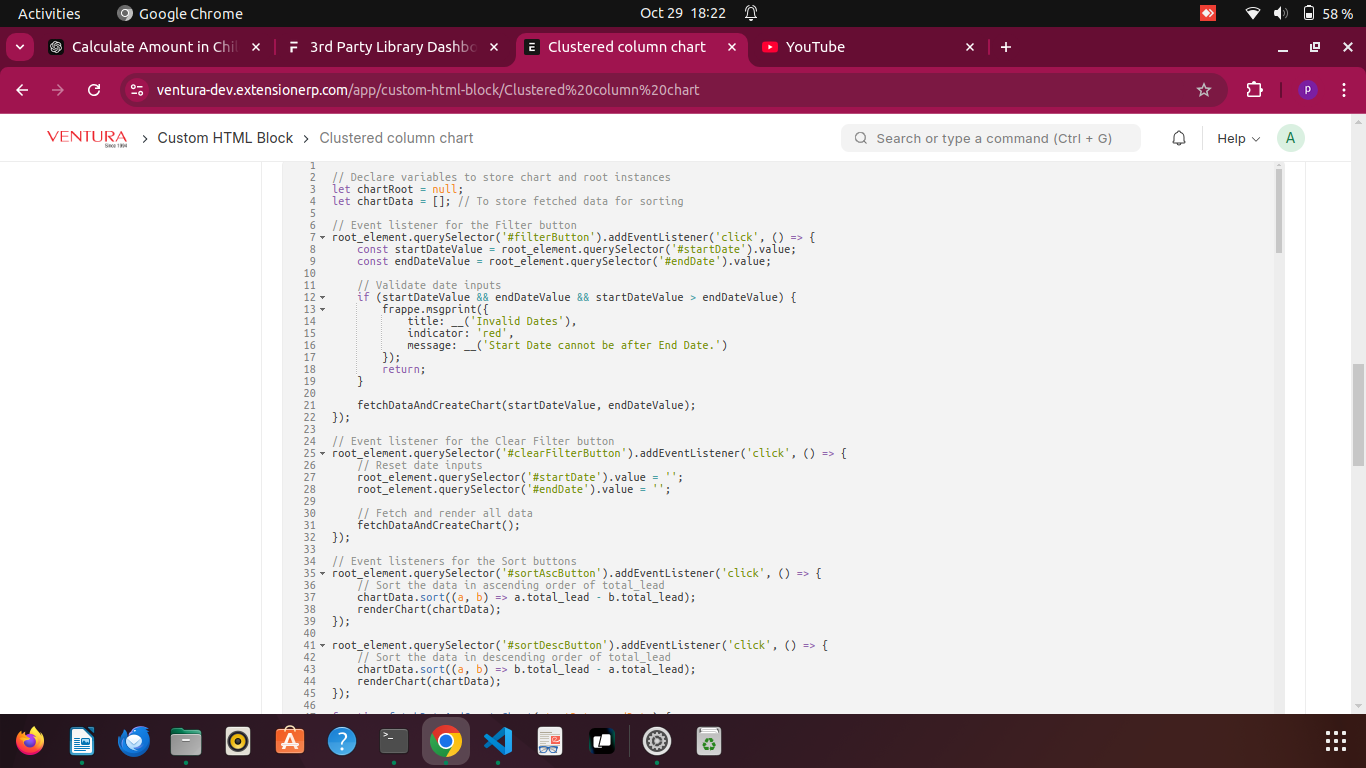
JS Code-

// Declare variables to store chart and root instances
let chartRoot = null;
let chartData = []; // To store fetched data for sorting

// Event listener for the Filter button
root_element.querySelector('#filterButton').addEventListener('click', () => {
    const startDateValue = root_element.querySelector('#startDate').value;
    const endDateValue = root_element.querySelector('#endDate').value;

    // Validate date inputs
    if (startDateValue && endDateValue && startDateValue > endDateValue) {
        frappe.msgprint({
            title: __('Invalid Dates'),
            indicator: 'red',
            message: __('Start Date cannot be after End Date.')
        });
        return;
    }

    fetchDataAndCreateChart(startDateValue, endDateValue);
});

// Event listener for the Clear Filter button
root_element.querySelector('#clearFilterButton').addEventListener('click', () => {
    // Reset date inputs
    root_element.querySelector('#startDate').value = '';
    root_element.querySelector('#endDate').value = '';

    // Fetch and render all data
    fetchDataAndCreateChart();
});

// Event listeners for the Sort buttons
root_element.querySelector('#sortAscButton').addEventListener('click', () => {
    // Sort the data in ascending order of total_lead
    chartData.sort((a, b) => a.total_lead - b.total_lead);
    renderChart(chartData);
});

root_element.querySelector('#sortDescButton').addEventListener('click', () => {
    // Sort the data in descending order of total_lead
    chartData.sort((a, b) => b.total_lead - a.total_lead);
    renderChart(chartData);
});

function fetchDataAndCreateChart(startDate, endDate) {
    // Build filters object
    let filters = { 'view_type': "Total Visits" };
    if (startDate) {
        filters['from_time'] = startDate; // Expecting 'YYYY-MM-DD'
    }
    if (endDate) {
        filters['to_time'] = endDate; // Expecting 'YYYY-MM-DD'
    }

    frappe.call({
        method: "frappe.desk.query_report.run",
        args: {
            report_name: "Sales Executive Wise- Footfall Report",
            filters: filters
        },
        callback: function(response) {
            if (!response.message || !response.message.result) {
                // If no data is returned, render an empty chart
                chartData = [];
                renderChart(chartData);
                return;
            }

            const result = response.message.result;

            // Map result to chart-friendly data, excluding Totals
            chartData = result
                .filter(row => row.custom_sales_person !== "Totals")
                .map(row => ({
                    custom_sales_person: row.custom_sales_person,
                    total_lead: parseInt(row.total_lead, 10) || 0,
                    lost_lead: parseInt(row.lost_lead, 10) || 0
                }));

            renderChart(chartData);
        },
        error: function(error) {
            console.error("Error fetching data:", error);
            // Optionally, notify the user about the error
            frappe.msgprint({
                title: __('Error'),
                indicator: 'red',
                message: __('There was an error fetching the data. Please try again.')
            });
            // Render an empty chart in case of error
            chartData = [];
            renderChart(chartData);
        }
    });
}

function renderChart(data) {
    // Dispose existing chart if it exists to prevent multiple Roots
    if (chartRoot) {
        chartRoot.dispose();
        chartRoot = null;
    }

    // Initialize a new Root instance
    chartRoot = frappe.amcharts.core.Root.new(root_element.querySelector("#chart-container"));

    // Apply themes
    chartRoot.setThemes([frappe.amcharts.themes.Animated.new(chartRoot)]);

    // Add a heading label
    chartRoot.container.children.push(
        frappe.amcharts.core.Label.new(chartRoot, {
            text: "Sales Executive Footfall Report", // Your desired chart title
            fontSize: 20,
            fontWeight: "bold",
            x: frappe.amcharts.core.percent(50),
            y: frappe.amcharts.core.percent(0), // Adjust position as needed
            centerX: frappe.amcharts.core.percent(50),
            centerY: frappe.amcharts.core.percent(5)
        })
    );

    // Create XYChart instance
    let chart = chartRoot.container.children.push(
        frappe.amcharts.xy.XYChart.new(chartRoot, {
            panX: true,
            panY: false,
            wheelX: "panX",
            wheelY: "zoomX",
            layout: chartRoot.verticalLayout
        })
    );

    // Add a legend
    let legend = chart.children.push(
        frappe.amcharts.core.Legend.new(chartRoot, {
            centerX: frappe.amcharts.core.percent(50),
            x: frappe.amcharts.core.percent(50)
        })
    );

    // Create X-Axis (Category Axis)
    let xRenderer = frappe.amcharts.xy.AxisRendererX.new(chartRoot, {
        minGridDistance: 30,
        labels: {
            rotation: -45,
            maxWidth: 100,
            truncate: true,
            tooltipText: "{custom_sales_person}"
        }
    });

    let xAxis = chart.xAxes.push(
        frappe.amcharts.xy.CategoryAxis.new(chartRoot, {
            categoryField: "custom_sales_person",
            renderer: xRenderer
        })
    );


    // Set data for X-Axis
    xAxis.data.setAll(data);

    // Add X-axis label
    chart.children.push(
        frappe.amcharts.core.Label.new(chartRoot, {
            text: "Sales Person", // Replace with your desired label
            fontSize: 16,
            fontWeight: "500",
            x: frappe.amcharts.core.percent(50), // Center horizontally
            y: frappe.amcharts.core.percent(100), // Position near bottom of chart
            centerX: frappe.amcharts.core.percent(50),
            centerY: frappe.amcharts.core.percent(100),
            rotation: 0
        })
    );


    // Create Y-Axis (Value Axis)
    let yAxis = chart.yAxes.push(
        frappe.amcharts.xy.ValueAxis.new(chartRoot, {
            renderer: frappe.amcharts.xy.AxisRendererY.new(chartRoot, {
                strokeOpacity: 0.1
            })
        })
    );

     // Add Y-axis label
    yAxis.children.unshift(
        frappe.amcharts.core.Label.new(chartRoot, {
            text: "Leads", // Replace with your desired label
            rotation: -90, // Rotate label to display vertically
            fontSize: 16,
            fontWeight: "500",
            x: frappe.amcharts.core.percent(0),
            y: frappe.amcharts.core.percent(50),
            centerX: frappe.amcharts.core.percent(0),
            centerY: frappe.amcharts.core.percent(50)
        })
    );


    // Function to create a series
    function createSeries(name, field) {
        let series = chart.series.push(
            frappe.amcharts.xy.ColumnSeries.new(chartRoot, {
                name: name,
                xAxis: xAxis,
                yAxis: yAxis,
                valueYField: field,
                categoryXField: "custom_sales_person"
            })
        );

        // Configure columns
        series.columns.template.setAll({
            tooltipText: "{name}, {categoryX}: {valueY}",
            width: frappe.amcharts.core.percent(80),
            tooltipY: 0,
            strokeOpacity: 0,

        });

        if (name === "Leads") {
        series.columns.template.set("fill", "#5F9EA0"); // Set fill color for total leads
        } else if (name === "Lost Leads") {
            series.columns.template.set("fill", "red"); // Set fill color for lost leads
        }

        // Set data for series
        series.data.setAll(data);
        series.appear();

        // Add labels on columns
        series.bullets.push(function() {
            return frappe.amcharts.core.Bullet.new(chartRoot, {
                locationY: 0,
                sprite: frappe.amcharts.core.Label.new(chartRoot, {
                    text: "{valueY}",
                    fill: chartRoot.interfaceColors.get("alternativeText"),
                    centerY: 0,
                    centerX: frappe.amcharts.core.percent(50),
                    populateText: true
                })
            });
        });

        // Add series to legend
        legend.data.push(series);

        return series;
    }

    // Create the required series
    let series1 = createSeries("Leads", "total_lead");
    let series2 = createSeries("Lost Leads", "lost_lead");

    // Add scrollbar (XYChartScrollbar)
    let scrollbarX = frappe.amcharts.xy.XYChartScrollbar.new(chartRoot, {
        orientation: "horizontal",
        height: 50,
    });
    chart.set("scrollbarX", scrollbarX);

    // Create scrollbar's own axes
    let sbxAxis = scrollbarX.chart.xAxes.push(
        frappe.amcharts.xy.CategoryAxis.new(chartRoot, {
            categoryField: "custom_sales_person",
            renderer: frappe.amcharts.xy.AxisRendererX.new(chartRoot, {})
        })
    );

    let sbyAxis = scrollbarX.chart.yAxes.push(
        frappe.amcharts.xy.ValueAxis.new(chartRoot, {
            renderer: frappe.amcharts.xy.AxisRendererY.new(chartRoot, {})
        })
    );

    // Set data for scrollbar X-Axis
    sbxAxis.data.setAll(data);

    // Add series to scrollbar
    let scrollbarSeries1 = scrollbarX.chart.series.push(
        frappe.amcharts.xy.ColumnSeries.new(chartRoot, {
            xAxis: sbxAxis,
            yAxis: sbyAxis,
            valueYField: "total_lead",
            categoryXField: "custom_sales_person"
        })
    );
    scrollbarSeries1.columns.template.setAll({ width: frappe.amcharts.core.percent(80) });
    scrollbarSeries1.data.setAll(data);

    // Set the initial zoom level on the main chart's X-Axis
    xAxis.events.once("datavalidated", function() {
        let totalLength = data.length;
        let visibleCount = 9; // Number of categories to display by default

        if (totalLength <= visibleCount) {
            // If data length is less than or equal to visibleCount, show all
            xAxis.zoom(0, 1);
        } else {
            let startIndex = 0;
            let endIndex = visibleCount - 1;
            xAxis.zoomToIndexes(startIndex, endIndex);
        }
    });

    // Synchronize scrollbar's selection with the main chart
    xAxis.on("start", function() {
        if (sbxAxis.start !== xAxis.start) {
            sbxAxis.start = xAxis.start;
        }
    });

    xAxis.on("end", function() {
        if (sbxAxis.end !== xAxis.end) {
            sbxAxis.end = xAxis.end;
        }
    });

    sbxAxis.on("start", function() {
        if (xAxis.start !== sbxAxis.start) {
            xAxis.start = sbxAxis.start;
        }
    });

    sbxAxis.on("end", function() {
        if (xAxis.end !== sbxAxis.end) {
            xAxis.end = sbxAxis.end;
        }
    });

    // Animate the chart appearance
    chart.appear(1000, 100);
}

// Initialize the chart with all data on load
fetchDataAndCreateChart();
Now, add this chart on Dashboard-
Create a new workspace and give a name.
Now, click on edit then click on + plus button.
Choose the Custom Block option and select your chart.
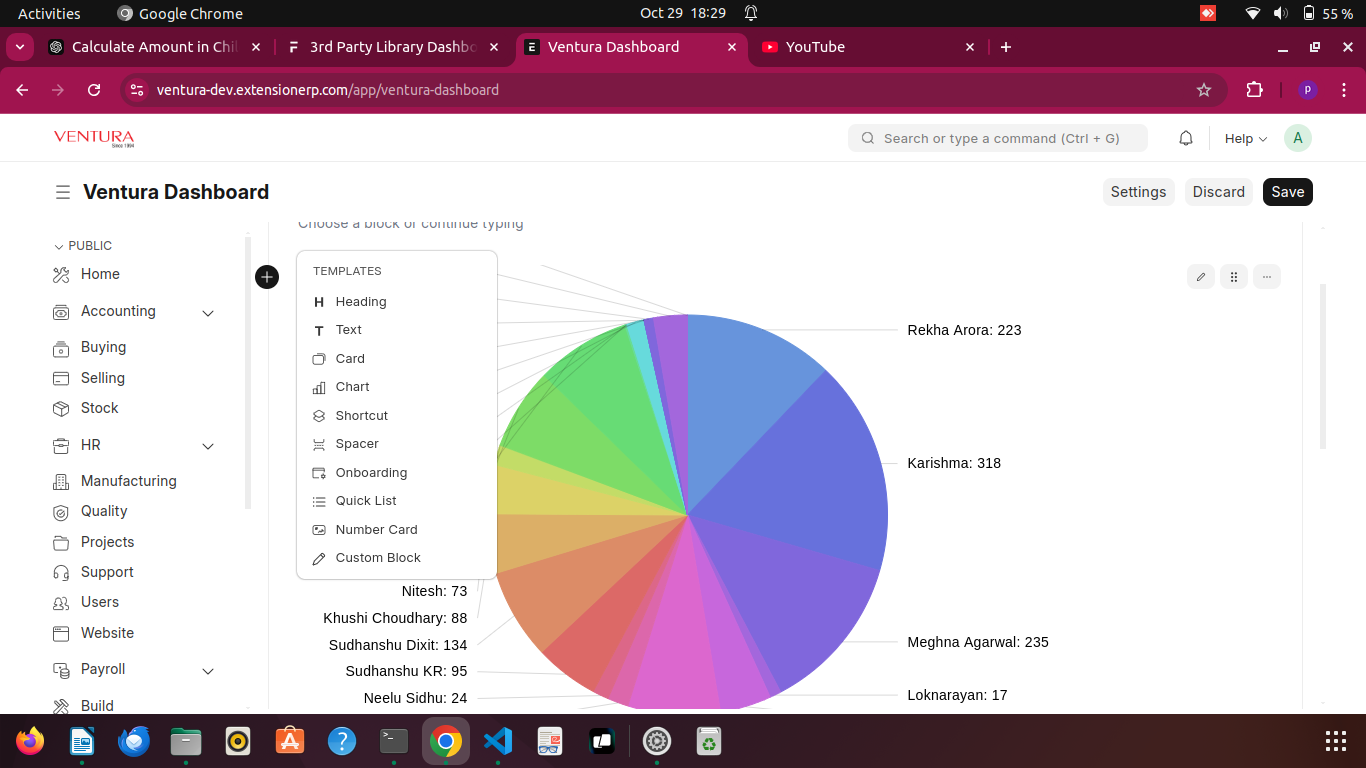
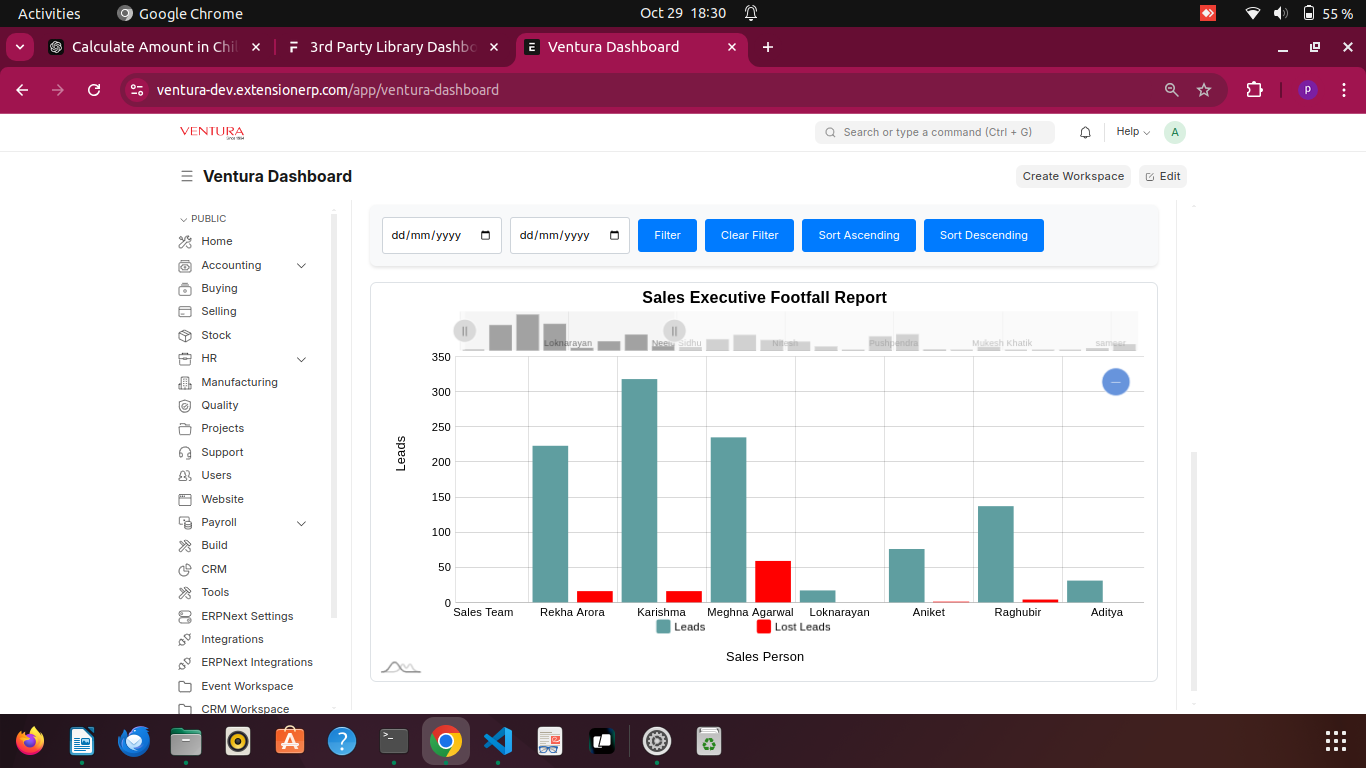
Choose Clustered column chart , now, chart is appear on dashboard.
~created by Payal Gupta(Software Developer)